While working on an SMS solution where the system responds to individual SMS text messages, each controlled by a single keyword. Each SMS has a response based on conditions such as, which phone was used to text, if the keyword was sent before from that phone, if a user had access to request a resource, etc. etc. I had to make sure that each and every possible scenario is handled by the system resulting in a successful or an error response. A logical approach would be to draw a flowchart outlining each possible path that ends in a response. While technically correct, I felt it did not deliver what I was looking for, which is a complete snapshot of all possible scenarios laid out, guaranteeing that no scenario was missing.
I recalled a good example in the book 'Groovy in Action', they used a NSD to identify how a method is invoked in a Groovy Class, depending on if the class instance is a Groovy Object, a Closure or an instance of Groovy interceptable. It identifies at the bottom of the chart which method gets invoked based on the path taken from top to bottom. I felt, if I laid out all possible scenarios in a diagram like this, it would 'shout' at me if I was missing a scenario/path a SMS message could take.
Next step was to draw one. Of course I could draw by hand, but I needed to document it as well. That resulted in a google search, and I did find couple of commercial products, and with little further search I found Structorizer (GPL), an open source product. Though rough on edges, it does the job. Very satisfied with the tool, outputs the diagram in a range of formats, including .png and .pdf.
As an comparison, I thought post an example NSD. Below you will find a NSD equivalent of a flowchart example found on wikipedia's flowchart page.
Flow Chart example (from wikipedia)

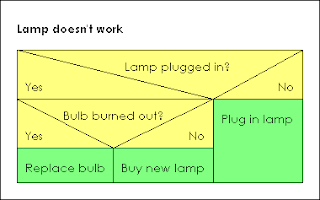
Equivalent NSD drawn using Structorizer.
So, experiment with NSD in addition to a flowchart. You never know why one diagram may add value over the other, even if technically they have the same information.
No comments:
Post a Comment